Why AI Inference Pipelines Fail Latency Targets in Real Systems
The model hit its 12 ms target on the benchmark harness. In the production pipeline — same model, same hardware, same input resolution — end-to-end latency landed at 47 ms with a p99 of 110 ms.
Nothing in the model itself had changed.
The team had been measuring the wrong thing for six weeks.
AI inference latency in deployed systems is rarely a model problem. It is almost always a pipeline problem, and the pipeline is what the benchmark harness hides.
Teams typically assume: if the model meets its inference time target on a representative input, the system will meet its end-to-end latency target.
In reality: model inference is one stage of a longer pipeline that includes capture, preprocessing, memory transfers, post-processing, and result delivery.
Each stage adds latency, and the stages contend for the same memory and compute resources. The model time measured in isolation is the floor, not the ceiling.
On an edge SoC running concurrent workloads, the pipeline overhead frequently exceeds the model inference time itself.
Quick Overview
Problem:
Common causes:
Where it appears:
Engineering focus:
Why AI Inference Latency Diverges From Benchmark Numbers
The first cause is measurement scope. Benchmark harnesses time model.forward() with pre-warmed tensors already on the device.
Production code starts from a sensor frame in DRAM, formatted in a layout the model does not accept. Color space conversion, normalization, and tensor reshaping consume cycles before the model runs.
On an embedded SoC with a shared LPDDR4 controller, this preprocessing competes with the inference engine for the same memory bandwidth. This is a class of problem that appears across edge AI deployment scenarios where preprocessing and inference share the same SoC memory subsystem.
The second cause is host-to-accelerator transfer cost. Moving an input tensor from CPU memory to GPU or NPU memory takes time, and that time scales with memory bandwidth, not compute.
On an embedded link such as PCIe Gen3 x4 (common on M.2-mounted accelerators and some SoC-to-FPGA bridges), useful throughput caps around 3.2 GB/s. A 1080p RGB float32 frame is 24 MB — that is 7 ms of pure transfer before any compute starts.
The third cause is kernel launch overhead. Each operator in the model triggers a kernel launch on the accelerator.
Models with hundreds of small operators accumulate launch overhead that can match or exceed the actual compute time.
The fourth cause is post-processing, often invisible in profiling because it runs on the host CPU. Non-maximum suppression, decoding, and serialization can consume more time than the model on detection workloads.
How Pipeline Stages Interact and Where Latency Hides
The full path on an edge inference system looks like this:
sensor → MIPI CSI → ISP → DMA to system memory → CPU preprocessing → DMA to accelerator → inference engine → DMA back to system memory → post-processing on CPU → output transport
In camera-based safety and driver-assistance systems, the same measurement discipline must also cover the display path. Model runtime alone excludes sensor exposure, ISP processing, camera transport, de-warping, multi-camera stitching, compositing and panel refresh. This is why glass-to-glass latency in real vision pipelines must be measured from photons entering the lens to the updated image reaching the driver, under sustained compute load rather than in an isolated bench test.
Bottlenecks at one node create failures at a different node.
If the ISP delivers frames at 30 fps but preprocessing on the CPU takes 22 ms per frame, the buffer between ISP and CPU fills. The DMA controller starts blocking on writes. The inference engine — which has nothing to do with the buffer — sees increased input arrival jitter because the pipeline upstream has stalled. Latency targets fail at the inference stage, but the cause sits two stages earlier.
The same pattern appears on the output side. If post-processing on the CPU contends with another thread — network transmission, logging, or telemetry — the accelerator sits idle waiting for the host to consume the previous result before it can dispatch the next inference.
Accelerator utilization drops, and the system reports low compute load while missing latency targets.
Memory bandwidth is the resource everyone underestimates. CPU preprocessing, ISP writes, accelerator reads, and post-processing all share the LPDDR controller on a typical SoC.
Sustained inference under load exposes this contention. Bench tests, which exercise one path at a time, do not.
The same pipeline-not-model failure pattern becomes even more visible when inference is connected to physical motion. In robotics systems, latency is no longer just a delayed output frame — it can push a joint controller outside its control window, make a planner act on stale perception, or create end-effector overshoot under sustained load. This is where the same pipeline-not-model pattern appears in motion loops: the model may meet its benchmark target, and the controller may meet its cycle time in isolation, but the integrated SoC fails because inference, ROS 2 callbacks, memory bandwidth, and thermal throttling compete inside the same timing budget.
This contention forces decisions at the hardware level, not only the software level.
Unified memory architectures eliminate one DMA hop but make every tenant compete for the same bandwidth. Discrete accelerators with dedicated memory remove the contention but reintroduce PCIe transfer cost and lane allocation constraints.
Zero-copy buffer strategies require alignment between the ISP, the accelerator driver, and the post-processing path — a constraint that propagates back to SoC selection and DDR layout decisions at the PCB level.
Three Failure Patterns You Will See in Production
Scenario 1
Works in single-stream benchmark mode at 12 ms per inference, fails under 4 concurrent video streams when end-to-end latency rises to 80 ms because four CPU preprocessing threads saturate the LPDDR controller.
Scenario 2
Stable at 30 fps for the first 10 minutes, breaks when SoC junction temperature crosses 95°C and thermal throttling reduces accelerator clock by 20-25%, pushing inference time from 12 ms to 16 ms while preprocessing stays constant — the buffer between stages overflows.
Scenario 3
Passes batch-1 latency tests in development, fails at integration when the post-processing thread shares a core with the network stack and tail latency p99 climbs from 18 ms to 95 ms under modest network traffic.
System-Level Embedded AI Engineering
Real-time AI failures rarely originate inside the model itself.
In production systems, latency instability usually appears at interaction points between memory bandwidth, transport layers, synchronization behavior, firmware scheduling, and hardware acceleration paths.
Promwad designs FPGA, SoC, embedded Linux, and high-speed data architectures for embedded AI systems operating under sustained real-time workloads.
Engineering Experience Across FPGA and Edge AI Platforms
Hands-on engineering experience with silicon and platform ecosystems from leading FPGA, SoC, and semiconductor vendors.
A Multi-Camera Inspection System That Hit Its Model Target and Missed Its System Target
In one of our projects, a client building a multi-camera industrial inspection system faced exactly this.
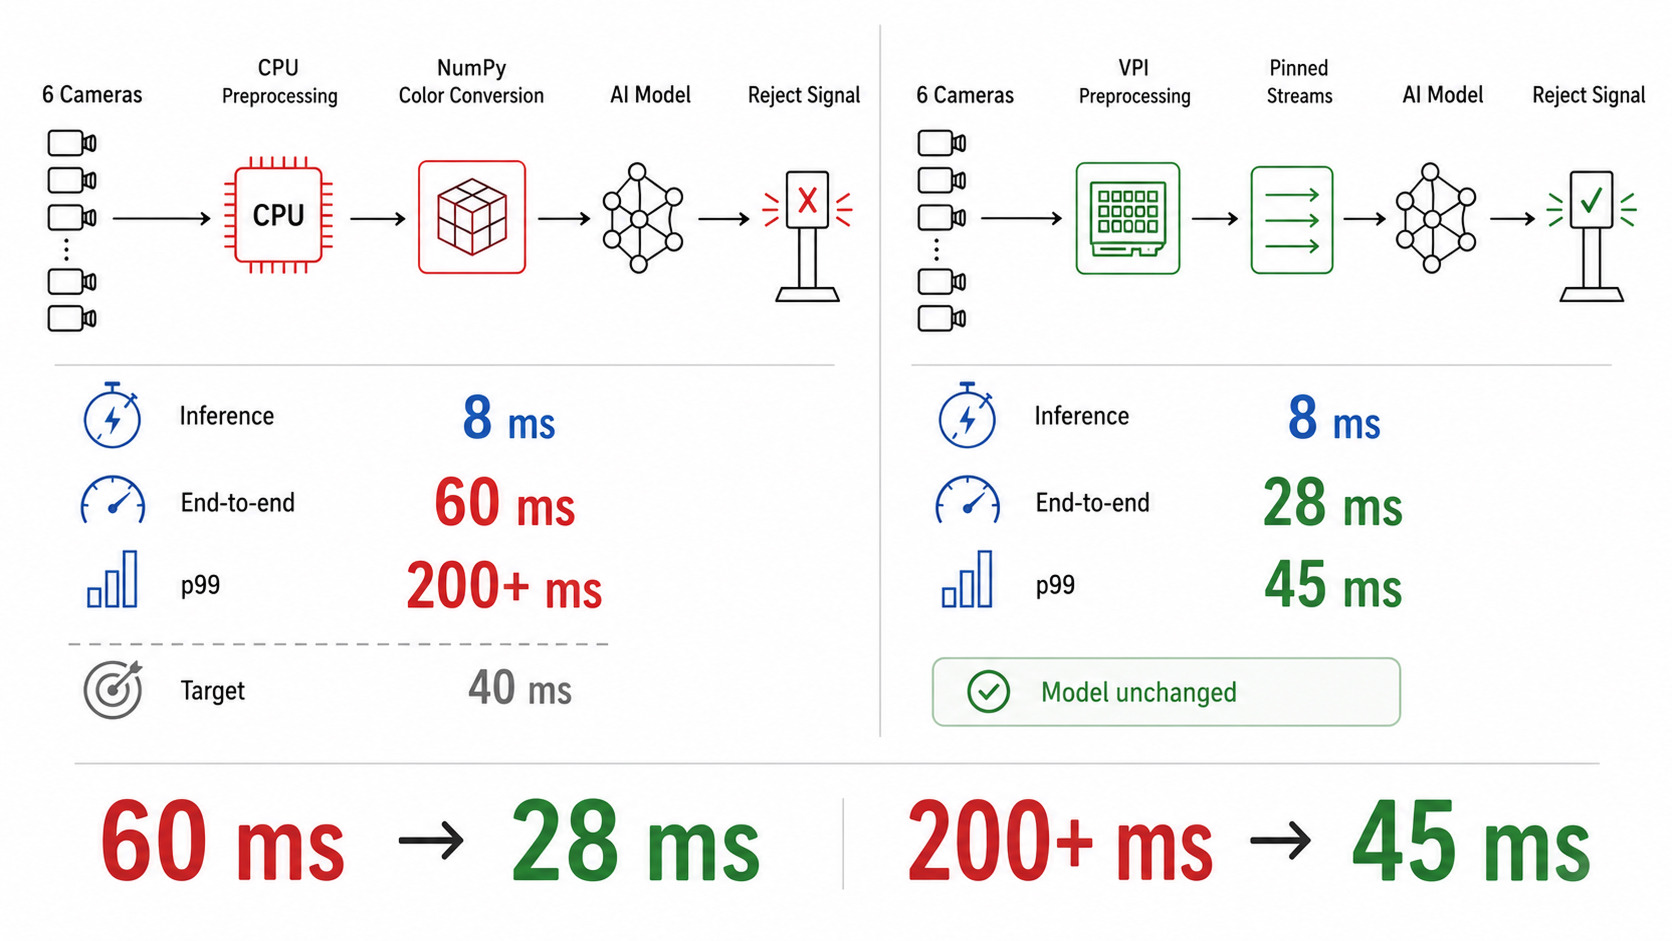
The model — a quantized detection network — hit 8 ms per inference on the reference benchmark.
End-to-end latency in the integrated system was 60 ms with a p99 above 200 ms, against a 40 ms target for the closed-loop reject mechanism.
The team had spent three weeks optimizing the model further, gaining nothing.
The actual bottleneck was on the host: preprocessing for 6 cameras ran on 4 CPU cores, and color space conversion was implemented in NumPy without SIMD intrinsics.
On the NVIDIA Jetson Orin platform used in this project, moving preprocessing from NumPy to the VPI library (which offloads color space conversion to the VIC and PVA blocks) and pinning each camera stream to a dedicated CPU core dropped end-to-end latency to 28 ms with p99 at 45 ms.
The model never changed.
How to Approach AI Inference Latency Problems
Step 1: Measure the full pipeline, not the model
Instrument every stage from sensor capture to output delivery. Timestamp each stage transition.
Record p50, p95, and p99 separately. Averages hide tail latency, and tail latency is what kills closed-loop systems.
Use ONNX Runtime profiling tools or vendor-specific tracers to capture per-operator times inside the model, but only after you have the per-stage breakdown.
Step 2: Isolate layers under realistic load
Run preprocessing alone, inference alone, and post-processing alone. Then run them in pairs. Then run the full system.
The deltas reveal contention.
If inference time grows when preprocessing runs concurrently, you have memory bandwidth contention.
If it grows when post-processing runs concurrently, you have CPU contention starving the dispatch thread.
If both grow with thermal load, you have a power and cooling problem masquerading as a software issue.
Step 3: Validate with the metric that matters in production
Closed-loop systems care about p99, not mean.
A pipeline that hits its target 99% of the time and misses by 5x in the remaining 1% is a failed system.
Validate against sustained load, real input distributions, and thermal soak — not synthetic batches at room temperature.
If this pattern is already visible in your system, this is typically the point where deeper analysis changes the outcome.
Real Trade-offs to Expect
- Increasing batch size to improve accelerator throughput increases p50 latency because samples wait for the batch to fill. On bursty workloads, p99 latency degrades sharply.
- Reducing model precision from FP16 to INT8 cuts inference time and memory bandwidth, but quantization-aware training (QAT) costs engineering weeks and may shift model failure modes on edge cases absent from calibration data.
- Choosing a dedicated NPU over GPU inference cuts power draw and frees the GPU for graphics, but NPU operator coverage is narrower. A single unsupported layer forces CPU fallback that can erase the latency gain.
- Prioritizing low p99 latency forces conservative thermal headroom, which means lower sustained clocks and lower throughput.
- Moving preprocessing into hardware reduces CPU load, but it increases architecture coupling between the sensor interface, memory layout, and acceleration path.
For systems where deterministic timing is non-negotiable, FPGA-based video and data processing eliminates much of the scheduling jitter introduced by CPU-driven transport and post-processing paths.
Typical System-Level Optimization Tasks

Latency Path Analysis
Investigating where timing instability appears across memory, transport, synchronization, preprocessing, inference, and output stages.
Architecture Isolation
Separating subsystem interactions to identify deterministic and non-deterministic latency sources under realistic load.
Hardware Acceleration Review
Evaluating when FPGA, GPU, CPU, NPU, or hybrid architectures become necessary for sustained real-time behavior.
Data Movement Redesign
Restructuring DMA, buffering, memory access, and zero-copy strategies to reduce avoidable latency between processing stages.
You May Be Facing This If:
- Model inference time on the benchmark harness meets target, but end-to-end pipeline latency misses by 2–4x.
- p99 latency is more than 3x the p50 under sustained load, even though the model itself shows stable per-inference time.
- Accelerator utilization stays below 60% during periods when the system misses latency targets.
- Latency targets are met for the first 5–15 minutes of operation and degrade after thermal soak.
- Adding a second concurrent inference stream more than doubles latency across both streams.
- CPU preprocessing time scales non-linearly when more sensor channels are added.
- Memory bandwidth on the SoC LPDDR controller reaches above 70% sustained utilization during inference.
Where Pipeline Engineering Becomes a System Architecture Problem
At this point, the problem requires a system-level approach rather than isolated fixes.
What this typically means in practice: profiling the full sensor-to-output path under representative load, restructuring the pipeline so that preprocessing, inference, and post-processing run on separate compute domains with explicit memory budgets, and validating against sustained thermal and load conditions — not bench tests.
This is where system-level Edge AI engineering becomes critical — not to optimize the model itself, but to stabilize the interaction between memory movement, scheduling behavior, preprocessing, and hardware acceleration under sustained load.
Projects with this failure pattern appear frequently in industrial vision systems, medical imaging pipelines, robotics perception stacks, and real-time video platforms where the inference engine is one of several real-time tenants on a shared SoC.
Pipeline latency is often only one symptom of a broader integration challenge. The same product may meet every inference benchmark during evaluation yet still miss its real-time targets once thermal limits, power budgets, memory pressure, unsupported operators, and future model revisions are introduced into the finished device. Looking at edge AI hardware from demo to production helps explain why system behavior changes after design-in — and why validating the complete hardware platform is just as important as optimizing the inference pipeline.
FAQ
Why does my model meet its inference target on the benchmark but miss it in production?
Is p99 latency or mean latency the right metric for real-time AI systems?
Can I fix latency problems by quantizing the model to INT8?
When does an FPGA make more sense than a GPU or NPU for inference?
What causes accelerator utilization to stay low while latency targets are missed?
Related Engineering Cases
- Real-Time Rail Safety Platform for Multi-Sensor Data: FPGA + multi-sensor fusion + edge AI analytics for low-latency safety insight on trains.
Analyze the Real Bottleneck
If your AI system meets benchmark targets but loses deterministic timing under real workloads, the bottleneck is already outside the model — and usually deeper in the system path.