Cisco TRex Traffic Generator: Running Load Tests on a Network

As we were designing yet another router, we used a very handy tool to test the network's performance – the Cisco TRex traffic generator. So what kind of tool is it? How does one use it? And how can it help network developers and engineers? Let's tackle these questions one at a time.
1. What is Cisco TRex?
It is an open-source traffic generator, which works on standard Intel DPDK-based processors and supports both stateful and stateless modes. It is a relatively simple to use piece of software and is fully scalable.
The documentation for it can be found here.
TRex allows developers to generate different types of traffic and analyze the data that is received as a result. The data analysis is performed on the MAC and IP levels. TRex users can set packet size and quantity, as well as control the speed of the data transfer.
The traffic generator works in a Linux environment
A key aspect that sets the TRex generator apart is its utilization of DPDK technology, which allows for the bypass of performance bottlenecks in the Linux network stack. DPDK, or Data Plane Development Kit, is a whole set of libraries and drivers that are used for fast packet processing by allowing the system to exclude the Linux network stack from the packet processing algorithms so that the tool can interact directly with the network device that's being tested.
DPDK transforms a general-purpose processor into a packet-forwarding server. This transformation eliminates the need for expensive switches and routers. However, DPDK does have some hardware limitations and the list of supported network adapters can be found here. The most most popular platform here is from Intel, i.e. it supports hardware that works with Linux drivers e1000, ixgbe, i40e, ice, fm10k, ipn3ke, ifc, and igc.
Another important nuance to consider is that in order for a TRex server to work with speeds of 10Gb/s and above, it requires the use of a multi-core processor, meaning at least 4 cores, and preferably an Intel CPU with hyper-threading support.
2. How to get and try out TRex
1) Download the archive from the trex-tgn.cisco.com server: trex-tgn.cisco.com/trex/release/
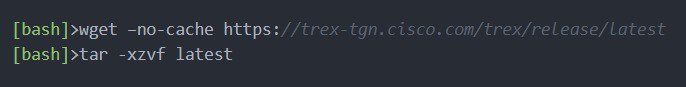
Unpack the archive in the user’s home directory “/home/user”, where “user” is replaced by the user name.
2) Configure the interfaces to send and receive data
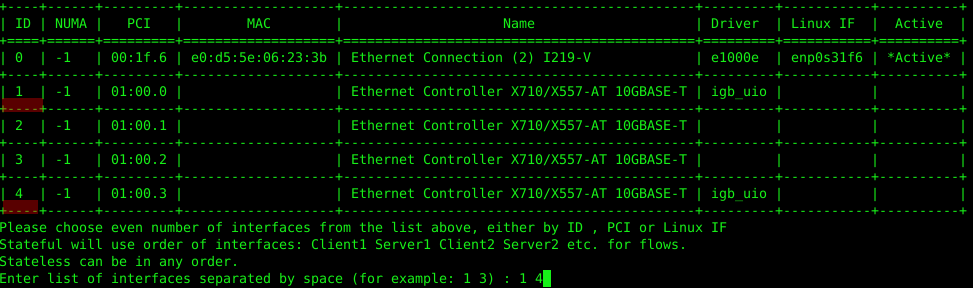
Configure the interfaces by using the utility "dpdk_setup_ports.py", which is included in the TRex package. The network interfaces used by TRex can be configured at the MAC or IP level. To launch it, run the utility with the interactive configuration key "sudo ./dpdk_setup_ports.py -i".
The first step is to drop the MAC-based configuration (Do you want to use MAC-based config? (y/n) n).
The second step is to select a pair of network interfaces. In our example, the Intel X710 network card supports 4 network interfaces, and we will use the 1st and 4th network card ports.
In the third step, the system will give the option to automatically create a closed configuration, which is when data leaves port 1 and goes to port 2 (and back), all on the same PC. We chose to abandon this scheme and configure a routing scheme for 2 PCs.
The fourth and fifth step are save the configuration to the file "/etc/trex_cfg.yaml" and confirm.
As an example, let's take a look at the configuration at the IP level for the following connection scheme:
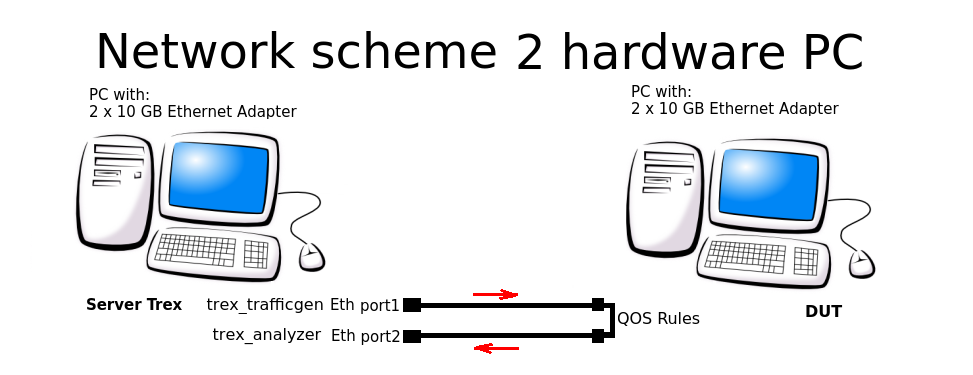
Network scheme for two PC
The configuration file is located here: "/etc/trex_cfg.yaml". An example of a simple configuration file is shown below, using a network card with 2 ports and a CPU supporting 8 threads:
### Config file generated by dpdk_setup_ports.py ###
- version: 2 interfaces: ['01:00.0', '01:00.3']
port_info:
- ip: 192.168.253.106
default_gw: 192.168.253.107
- ip: 192.168.254.106
default_gw: 192.168.254.107
platform:
master_thread_id: 0
latency_thread_id: 1
dual_if:
- socket: 0
threads: [2,3,4,5,6,7]
In the configuration:
- '01:00.0', '01:00.3' are the names of the Ethernet interfaces in the Linux system used.
- ip: 192.168.253.106 is the address of the Server TRex PC port from which the traffic is generated.
- default_gw: 192.168.253.107 is the address of port 1 of the PC DUT (Device under test).
- ip: 192.168.254.106 is the address of Server TRex PC port from which traffic is returned after going through QOS rules.
- default_gw: 192.168.253.107 is the address of 2nd port of the DUT.
Warning! The TRex system prohibits using the same subnet when generating traffic flows. For this purpose the subnets 16.0.0.0 and 48.0.0.0 should be used when generating packets.
3) Configuring the interfaces on a remote machine
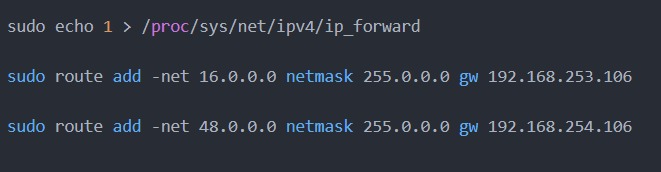
Now we have to set up the forwarding and routes so the DUT that we are routing traffic through knows where to send and receive the packets.
Let's configure routing rules on the DUT:
sudo echo 1 > /proc/sys/net/ipv4/ip_forward
sudo route add -net 16.0.0.0 netmask 255.0.0.0 gw 192.168.253.106
sudo route add -net 48.0.0.0 netmask 255.0.0.0 gw 192.168.254.106
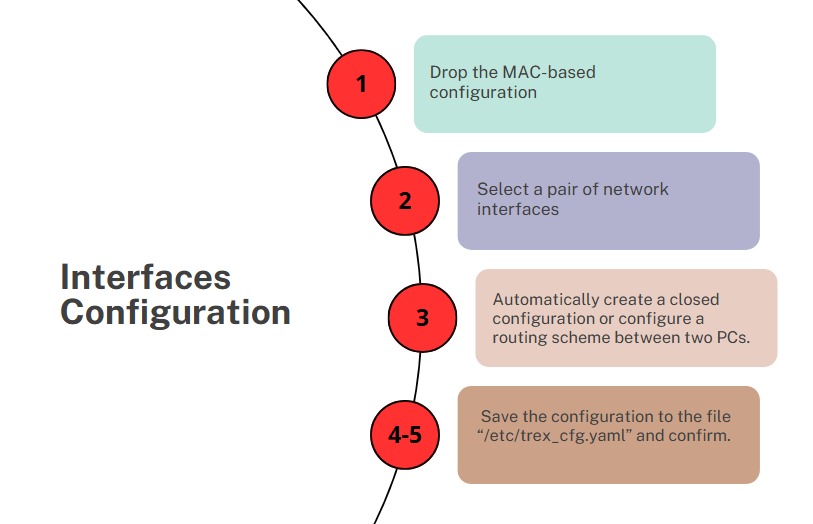
Steps of interface configuration
4) Launch the TRex server in astf mode:
cd v2.XX
sudo ./t-rex-64 -i –astf
If the TRex server is launched successfully, the system will display that the Ethernet ports that will be used for testing are bound:
The ports are bound/configured.
port : 0
------------
link : link : Link Up - speed 10000 Mbps - full-duplex
promiscuous : 0
port : 1
------------
link : link : Link Up - speed 10000 Mbps - full-duplex>
promiscuous : 0
number of ports : 2
max cores for 2 ports : 1
tx queues per port : 3
5) Launch the TRex console
With the help of the console, which should be open in a separate window, start the generation of the traffic flow using the pre-made examples (the folder with the examples can also be found in the TRex archive):
cd v2.XX
./trex-console
start -f astf/http_simple.py -m 1
start (options):
-a (all ports)
-port 1 2 3 (ports 1 2 3)>
-d duration (-d 100 -d 10m -d 1h)
-m stream strength (-m 1 -m 1gb -m 40%)
-f load from disk the streams file
After a successful launch, the traffic statistics will be displayed in the TRex server console:
Global stats enabled
Cpu Utilization : 0.3 % 0.6 Gb/core
Platform_factor : 1.0
Total-Tx : 759.81 Kbps
Total-Rx : 759.81 Kbps
Total-PPS : 82.81 pps
Total-CPS : 2.69 cps
Expected-PPS : 0.00 pps
Expected-CPS : 0.00 cps
Expected-L7-BPS : 0.00 bps
Active-flows : 2 Clients : 0 Socket-util : 0.0000 %
Open-flows : 641
3. Development and testing automation using TRex
We wrote a lot of tests for TRex while we were developing the network router. Naturally, we considered whether we could run them automatically using python. This is what we came up with as a result:
We started the TRex server in stl mode:
cd v2.XX
sudo ./t-rex-64 -i –stl
We set an environment variable for python, since TRex works in conjunction with python.
export PYTHONPATH=/home/!!!user!!!/v2.XX/automation/trex_control_plane/interactive, where "!!!user!!" is the user name and home directory, and v2.XX is version of TRex software that was downloaded and unpacked into this folder.
The we launched the traffic generator with python. The example configuration listing is shown below.
python example_test_2bidirectstream.py
Expected result:
Transmit: 10000.24576MByte/s Receive: 10000.272384MByte/s
Stream 1 TX: 4487179200 Bit/s RX: 4487179200 Bit/s
Stream 2 TX: 2492873600 Bit/s RX: 2492873600 Bit/s
Stream 3 TX: 1994294400 Bit/s RX: 1994294400 Bit/s
Stream 4 TX: 997147200 Bit/s RX: 997147200 Bit/s
Let's break this example down:
c = STLClient(server = '127.0.0.1')
Create a connection to the TRex server. In our example, the connection was created on the same machine as the server.
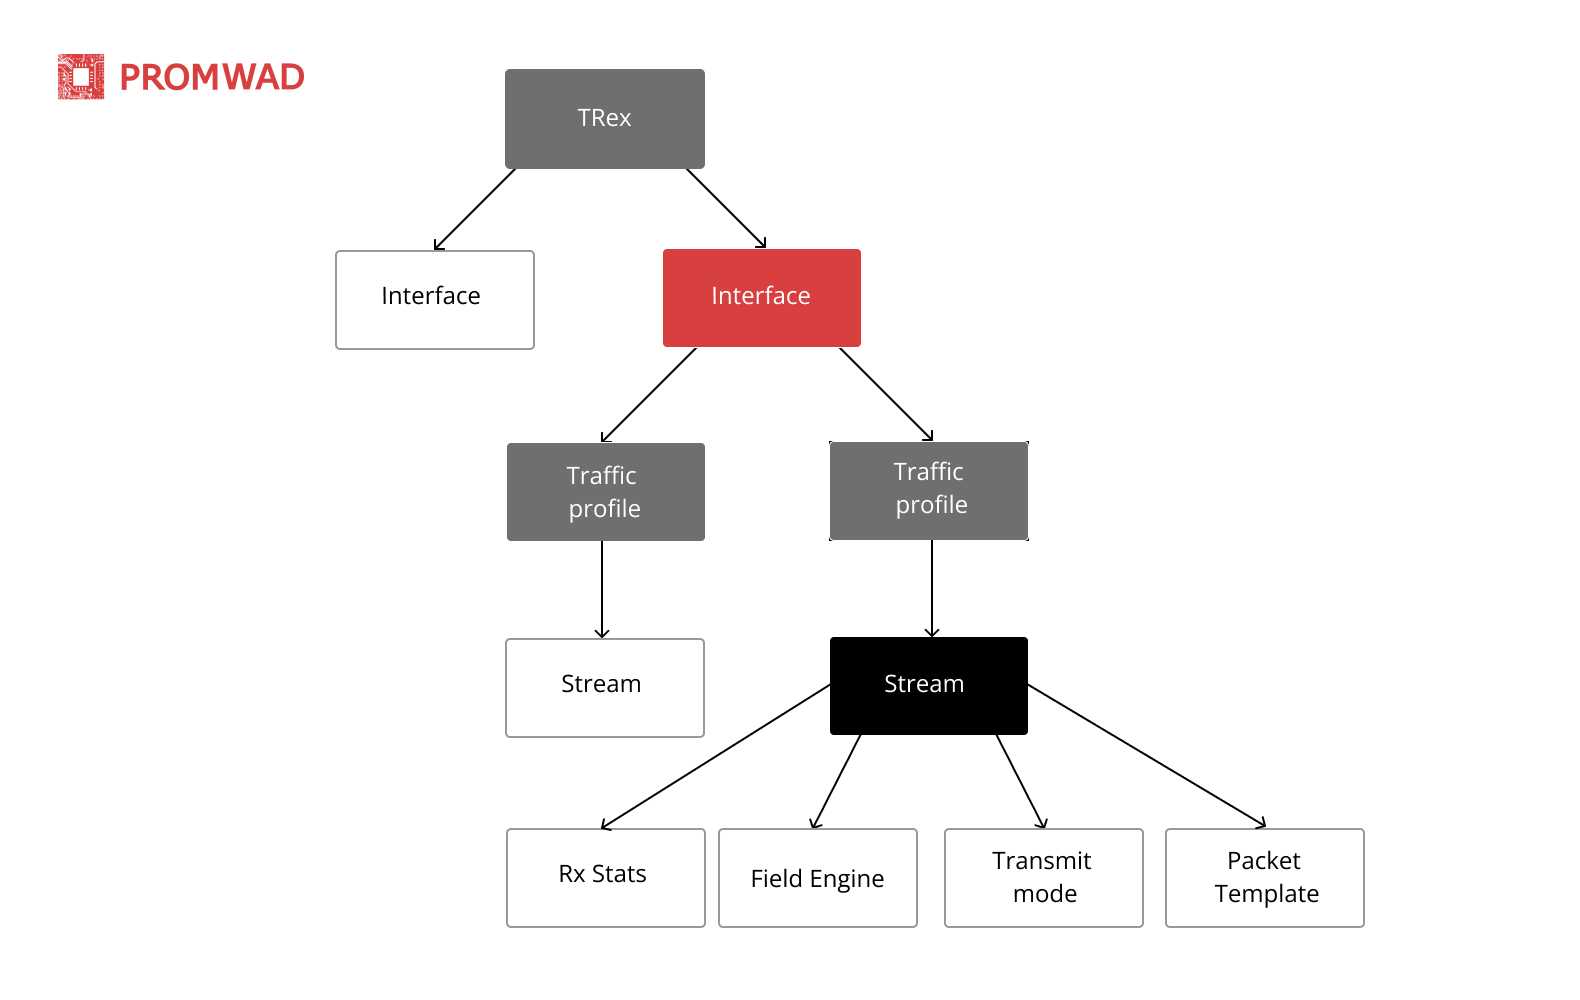
- «base_pkt_dir_a, base_pkt_dir_b, base_pkt_dir_c, base_pkt_dir_d» are packet templates with source and destination addresses and source and destination ports. In this example, 4 streams are created: 2 in one direction and 2 in the opposite direction.
- «s1, s2, s3, s4» – we queried the STLStream class for the parameters of the generated streams, such as the stream ID and bitrate. In our case, the parameters we: ID1=4.5 Gbps, ID2=2.5 Gbps, ID3=2 Gbps, ID4=1 Gbps.
Stream configuration file listing example_test_2bidirectstream.py
# get TRex APIs
from trex_stl_lib.api import *
c = STLClient(server = '127.0.0.1')
c.connect()
try:
# create a base packet with scapy
base_pkt_dir_a = Ether()/IP(src="16.0.0.1",dst="48.0.0.1")/UDP(dport=5001,sport=50001)
base_pkt_dir_b = Ether()/IP(src="48.0.0.1",dst="16.0.0.1")/UDP(dport=50001,sport=5001)
base_pkt_dir_c = Ether()/IP(src="16.0.0.2",dst="48.0.0.2")/UDP(dport=5002,sport=50002)
base_pkt_dir_d = Ether()/IP(src="48.0.0.2",dst="16.0.0.2")/UDP(dport=50002,sport=5002)
# pps : float
# Packets per second
#
# bps_L1 : float
# Bits per second L1 (with IPG)
#
# bps_L2 : float
# Bits per second L2 (Ethernet-FCS)
packet_size = 1400
def pad(base_pkt):
pad = (packet_size - len(base_pkt)) * 'x'
return pad
s1 = STLStream(packet=STLPktBuilder(base_pkt_dir_a/pad(base_pkt_dir_a)), mode=STLTXCont(bps_L2=4500000000), flow_stats=STLFlowStats(pg_id=1))
s2 = STLStream(packet=STLPktBuilder(base_pkt_dir_b/pad(base_pkt_dir_b)), mode=STLTXCont(bps_L2=2500000000), flow_stats=STLFlowStats(pg_id=2))
s3 = STLStream(packet=STLPktBuilder(base_pkt_dir_c/pad(base_pkt_dir_c)), mode=STLTXCont(bps_L2=2000000000), flow_stats=STLFlowStats(pg_id=3))
s4 = STLStream(packet=STLPktBuilder(base_pkt_dir_d/pad(base_pkt_dir_d)), mode=STLTXCont(bps_L2=1000000000), flow_stats=STLFlowStats(pg_id=4))
my_ports = [0, 1]
c.reset(ports = [my_ports[0], my_ports[1]])
# add the streams
c.add_streams(s1, ports = my_ports[0])
c.add_streams(s2, ports = my_ports[1])
c.add_streams(s3, ports = my_ports[0])
c.add_streams(s4, ports = my_ports[1])
# start traffic with limit of 10 seconds (otherwise it will continue forever)
# bi direction
testduration = 10
c.start(ports=[my_ports[0], my_ports[1]], duration=testduration)
# hold until traffic ends
c.wait_on_traffic()
# check out the stats
stats = c.get_stats()
# get global stats
totalstats = stats['global']
totaltx = round(totalstats.get('tx_bps'))
totalrx = round(totalstats.get('rx_bps'))
print('Transmit: {}MByte/s Receive: {}MByte/s'.format((totaltx / 1000000), (totalrx / 1000000)))
c.clear_stats(ports = [my_ports[0], my_ports[1]])
# get flow stats
totalstats = stats['flow_stats']
stream1 = totalstats[1]
stream2 = totalstats[2]
stream3 = totalstats[3]
stream4 = totalstats[4]
totaltx_1 = stream1.get('tx_pkts')
totalrx_1 = stream1.get('rx_pkts')
print('Stream 1 TX: {} Bit/s RX: {} Bit/s'.format((totaltx_1['total'] / testduration * packet_size * 8),
(totalrx_1['total'] / testduration * packet_size * 8)))
totaltx_2 = stream2.get('tx_pkts')
totalrx_2 = stream2.get('rx_pkts')
print('Stream 2 TX: {} Bit/s RX: {} Bit/s'.format((totaltx_2['total'] / testduration * packet_size * 8),
(totalrx_2['total'] / testduration * packet_size * 8)))
totaltx_3 = stream3.get('tx_pkts')
totalrx_3 = stream3.get('rx_pkts')
print('Stream 3 TX: {} Bit/s RX: {} Bit/s'.format((totaltx_3['total'] / testduration * packet_size * 8),
(totalrx_3['total'] / testduration * packet_size * 8)))
totaltx_4 = stream4.get('tx_pkts')
totalrx_4 = stream4.get('rx_pkts')
print('Stream 4 TX: {} Bit/s RX: {} Bit/s'.format((totaltx_4['total'] / testduration * packet_size * 8),
(totalrx_4['total'] / testduration * packet_size * 8)))
except STLError as e:
print(e)
finally:
c.disconnect()
Conclusion
While preparing this tutorial, we ran and tested the DUT system with 4 streams, and then collected information on the streams and global statistics.
The operation described above was run using python, which means that TRex can be used to automate testing and debugging of network devices and software products. This can be done in a loop or by running sequential tests in python.
So is TRex by Cisco better or worse than other similar traffic generators and why? Let's take the popular client-server program iperf as an example. In the TRex use case, we described the stream setup and process. Both of the aforementioned testing and debugging tools are good in their own ways – iperf is great for running quick functionality checks on the fly, while TRex does a good job managing the automation of testing and designing network devices and complex systems for the telecom industry. In the latter case, in is important to be able to configure multithreaded streams, so that each stream can be configured for a particular task and the output then analyzed.
TRex supports the creation of templates for almost any kind of traffic and can amplify them in order to generate large-scale DDoS attacks, including TCP-SYN, UDP and ICMP streams. The ability to generate massive traffic flows allows the user to simulate attacks from different clients and on multiple target servers.
So if you haven't tried this tool out yet, keep this mind. But if you have, feel free to share your examples and feedback in the comments. It would be interesting to find out what our fellow engineers think about TRex and how they've used it.
Write to us! info@promwad.com
Our projects